How I Started Tracking My Twitter Follower Growth Daily

For two years I told myself I was growing on Twitter. The follower number was higher than it had been the year before, and that was the entire dataset I was working from. Then a client asked me to put numbers on the claim. I went to look, the platform showed me one number, and I realized I had been making strategic decisions on what was effectively a vibe.
Can you actually see your Twitter follower growth over time?
Not natively. Circleboom snapshots your follower count daily from an official X Enterprise Developer company and renders a growth chart with paired daily gain-and-loss bars. The platform itself only shows the current count.
→ Track Twitter follower growth on your account
The Year I Was Operating Without a Chart
The client conversation that broke this for me was short. They wanted to know which of the three positioning shifts I had run that year had actually moved the audience. I had three theories about which one worked best, three confident sentences I had prepared, and zero dated data to back any of them up.
The follower count had grown over the year. That was true. But I could not show them whether it had grown faster after positioning shift A or B or C, because I had never recorded the count at the points in time those shifts happened. The number on the profile was a snapshot of right now. There was no history.
I had to admit, on a call, that I had been picking which positioning to keep based on what felt right rather than what the data showed. The decision-quality cost of that conversation was high enough that I went looking for a tracker the same afternoon, and that is when I realized Twitter does not show new follower notifications or any meaningful growth history either.
What I Tried Before the Right Workflow
The first thing I did was wrong. I opened a Google Sheet, typed the date and the current follower count into it, and committed to do that every Monday. The intent was good. The execution lasted exactly six weeks before I forgot for a long enough stretch that the diff windows became too wide to attribute anything.
The second thing I tried was screenshotting my profile every week. Same problem, more friction. I had a folder of dated screenshots and no way to chart them, because turning images into a growth line requires manually transcribing the numbers, which is the work I was trying to avoid.
The third thing I tried was using the native analytics surface on the X app. The follower numbers there are aggregated weekly with no daily granularity, and the historical depth is shallow enough that I could not see the dates I actually wanted to analyze.
That triple failure is what pushed me toward Circleboom's follower growth stats page, where the snapshots run automatically and the chart populates without me having to remember to do anything.
How I Track My Twitter Follower Growth Now
The setup I use now is the one I should have set up two years ago. Three actions, then it runs.
Connect the X account to Circleboom
- Log in to Circleboom Twitter and authorize the account with official OAuth. The snapshot loop begins immediately.

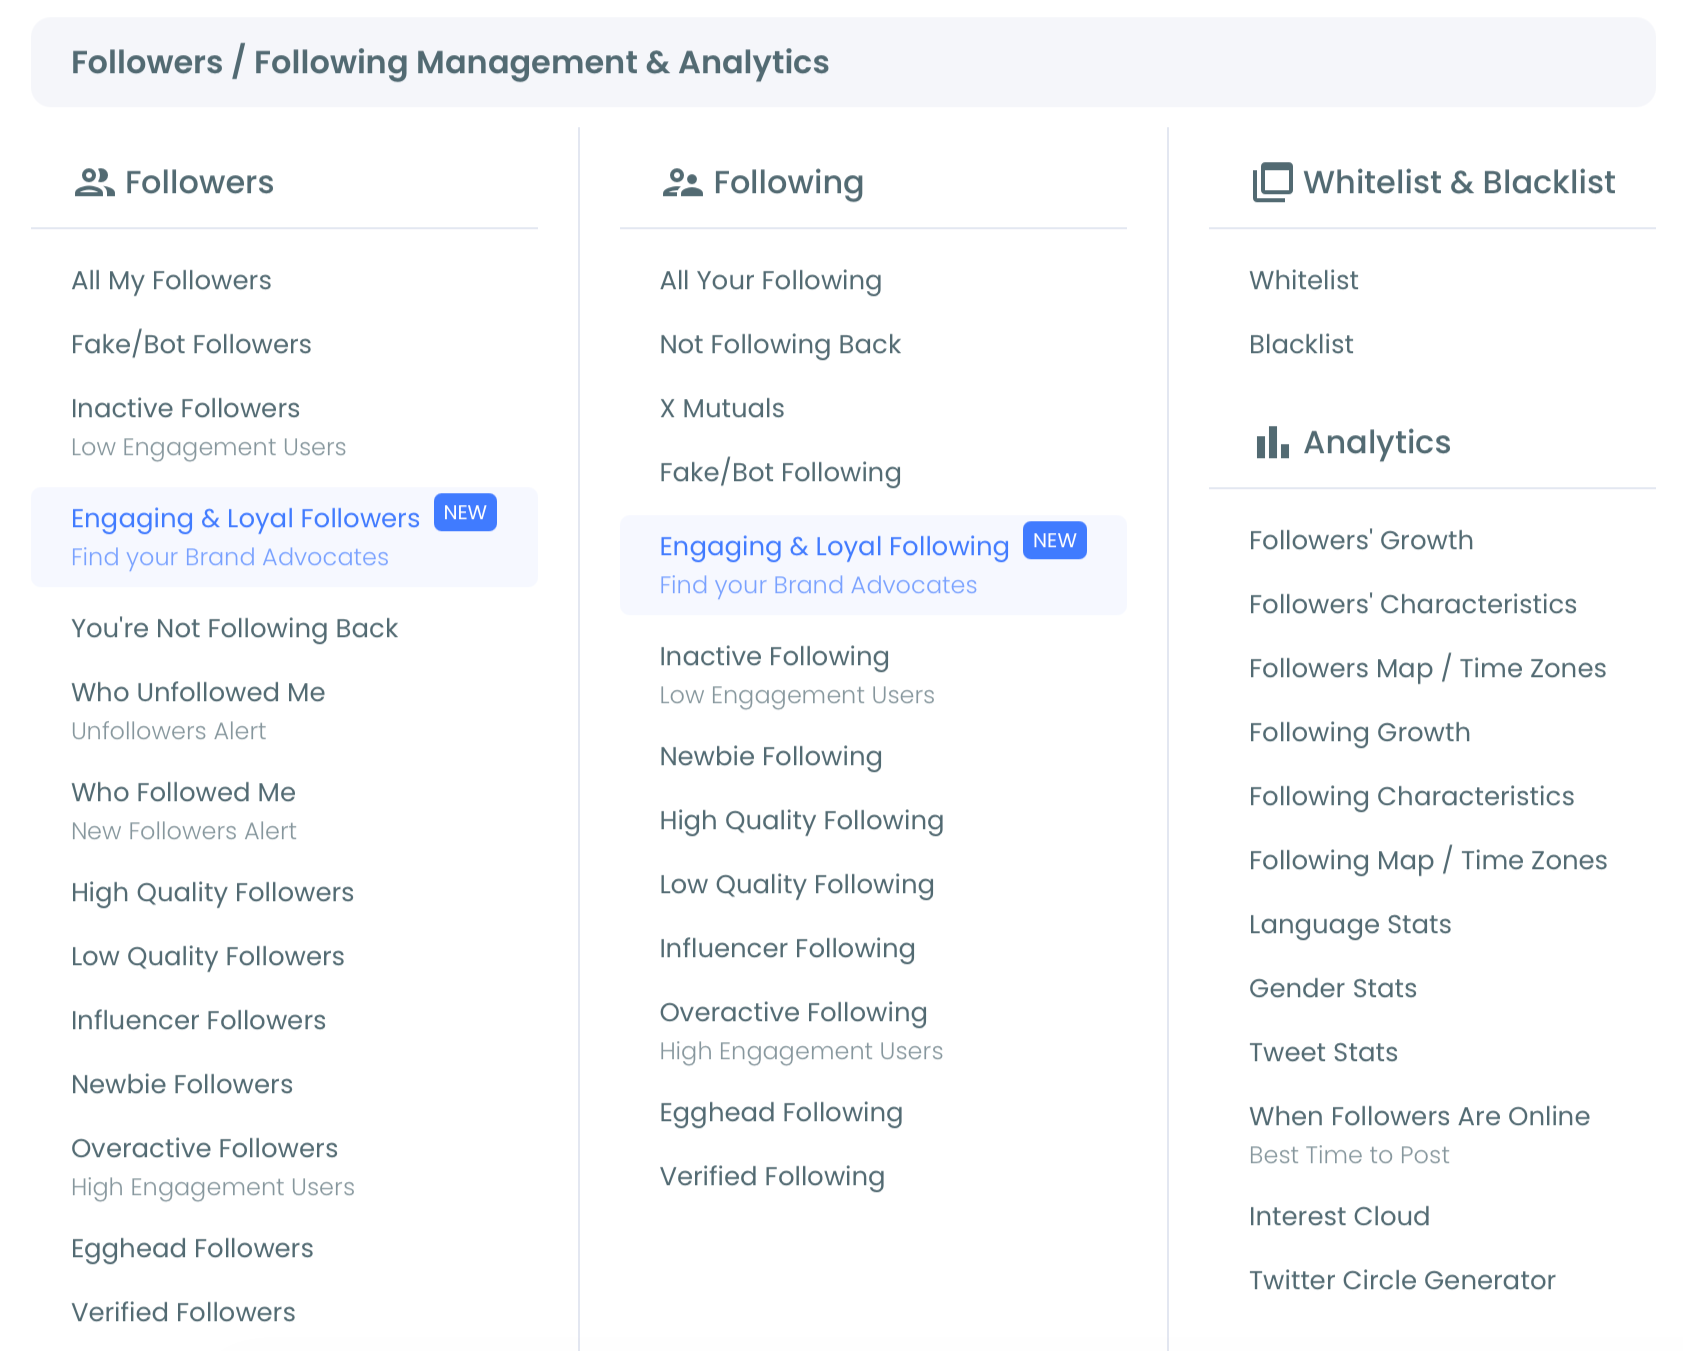
Open the Followers' Growth section
- Open the Follower / Following Management and Analytics menu and scroll to the Followers' Growth analytics surface.
Switch between Performance View and Daily Change View
- Use Performance View for the cumulative trend line and the macro story. Switch to Daily Change View when you need to read the individual gain-and-loss bars on specific dates. The macro view answers strategy questions. The daily view answers attribution questions.
That ordering matters to me because I had been treating growth as one question for years. It is actually two. The curve shows whether the audience is expanding over months. The bars show whether last week's specific posts contributed or did not. They are different questions and they need different views.
See it live: the moment the cumulative line and the daily-change bars start telling two different stories about the same account.
What the Dated Data Changed for Me
The first month after the snapshots started, I learned that my growth was not coming from where I assumed it was. I had been crediting one weekly thread format for most of my new followers. The Daily Change View showed me that the actual gain bars clustered around a different format I had been running irregularly, almost as filler. The thread format I was proud of was producing flat days.
The second month, I learned that my drops were not random. They clustered around dates when I had posted three or more reactive replies to news cycles I did not have a real angle on. Once I saw the cluster, the connection was obvious, but I would never have seen it without dated bars side by side with my posting log.
The third month was the one that paid the deepest dividend. I noticed a long quiet week where the bars were all near-zero on both sides. That kind of flat stretch is invisible in cumulative views because the line just sits still. In daily-bar form, it was clearly a week where the audience neither arrived nor left, which is a different signal from "growth is steady." It usually means the content was not reaching anyone new, which is the only signal that ever predicts a slow stretch ahead of time.
There is one reframe I would not have expected to write. I used to treat follower growth as something I influenced indirectly through content. Once I had dated data, I started treating it as direct feedback on specific posts. The lag between a strong post and a measurable gain is short enough to attribute. The lag between a poor post and a measurable drop is even shorter. Both signals are usable inside a few days of the post, not weeks.
Circleboom runs against X's published platform limits so the snapshot loop stays compliant. The same dashboard surfaces a new follower check and a broader Twitter user analytics view so you can connect growth to the actual people arriving and leaving, not just count changes. DataReportal's social media baseline confirms what most operators eventually figure out: at typical active-account growth rates, you cannot maintain a manual tracking habit long enough for the data to mean anything.
See your Twitter follower growth over time is the page I open whenever I want to attribute anything. The macro view tells me whether the strategy is working. The daily view tells me which posts are doing the work.
Related Circleboom reading that goes deeper on the threads above:
- how do I track my Twitter followers daily, weekly, monthly covers the cadence question.
- Twitter does not show new follower notifications explains the platform gap.
- why am I suddenly getting new followers on attribution.
- how can I track where my Twitter followers came from on the source-of-growth question.
Questions Readers Ask
How quickly does the growth chart become useful?
A few weeks of data start showing weekly trends. A month is enough to spot patterns. Three months is where the chart becomes genuinely strategic because you can compare across multiple posting cycles and campaigns.
Can I attribute specific posts to specific gain spikes?
Not perfectly, because growth has lag and noise. But the Daily Change View combined with your own posting log lets you identify the date clusters that line up with specific content choices, which is enough for most strategic decisions.
What happens to my data if I disconnect the account?
The historical snapshots are preserved. If you reconnect later, the gap shows as missing data, but the earlier history remains in the dashboard for reference.
Why does the daily bar sometimes show zero on a day I gained a follower?
The snapshot cadence is daily, which means very small same-day churn (one follow plus one unfollow on the same day) can net to zero on the chart. The cumulative line still moves accurately over longer windows.
The Habit That Stuck
The habit that finally stuck for me is the Friday review. I open the Daily Change View, scan the last week of bars, and ask whether the green bars cluster around content I want to do more of and whether the red bars cluster around content I should do less of. That is the entire weekly process.
If you wait to set this up until you actually need the data, the data will not be there. The snapshot loop only sees forward, so the longer the tracker has been running before a slump or a campaign arrives, the more usable context you have when you need to make a decision about it.
Start tracking your Twitter follower growth and a month from now you will be making content decisions on real data instead of the vibe I was running on for years.