
Google Search Console to Google Sheets: How to Export Your Performance Data (and Why You Need To)
Get Search Console performance data into Google Sheets with manual exports, the Sheets add-on, or the API, so you keep data past the 16 month retention limit.


If you have ever tried to build a client report straight from Google Search Console, you have run into the same wall everyone else hits: the Performance report shows you a chart and a table, and then it stops. You cannot filter by ten different query segments at once, you cannot build a pivot table on top of it, and the moment you want to compare this quarter to the same quarter two years ago, the data simply is not there anymore. Search Console was built as a diagnostic tool, not a reporting tool, and the gap between those two purposes is exactly where this workflow lives.
The practical fix is getting the raw rows out of Search Console and into Google Sheets, where you actually control the pivoting, charting, and archiving. That is not a workaround; it is how most SEOs and analysts have always worked with this data.
This guide walks through every real method for doing it, from the built-in export button to a scheduled API pull, and covers what changes now that Search Console also tracks content on Instagram, TikTok, X, and YouTube.
📢 Resources to learn about using GSC API data with google sheets
Why the UI Alone Isn't Enough
Two limits in Search Console force this workflow, and it helps to understand both before you pick a method.
First, the Performance report caps out at 1,000 rows per table view. If a site has 4,000 ranking queries in a given month, the UI simply will not show you rows 1,001 through 4,000, no matter how you filter or sort. For a small blog that might not matter. For an established site with a long tail of query variations, it means the UI is showing you a slice, not the full picture.
Second, and more importantly for anyone doing historical reporting, Search Console retains only 16 months of performance data. Ask for data from 20 months ago and there is nothing to return, in the UI or through the API. If you did not export it while it was still inside that window, it is gone. This is the real reason regular exports matter: they are not just convenience, they are the only way to build a historical archive longer than Google's own retention policy allows.
A third, quieter limitation is query anonymization. Search Console does not report every single query verbatim. Very low-volume or rare queries, ones Google considers potentially identifying of an individual searcher, get folded into an aggregate bucket rather than shown as discrete rows. You will not see this labeled dramatically, but if you add up query-level clicks and compare them to the total clicks shown for a page, you will often find a gap. That gap is the anonymized long tail, and no export method recovers it because Google never exposes it in the first place.
Method 1: The Built-In Export Button
This is the fastest option and the one most people should start with.
- Open Google Search Console and go to the property you want, then click Performance (either "Performance on Search results" or, on a platform property, its equivalent performance view).
- Set your filters and date range first, since the export respects whatever is currently on screen: query filters, page filters, country, device, search type, and the date range picker.
- In the top right of the report, click Export.
- Choose Google Sheets, CSV, or Excel (.xlsx). Google Sheets creates a new spreadsheet directly in your Drive with separate tabs for Queries, Pages, Countries, Devices, Dates, and Search Appearance.
- Open the resulting sheet and you have your data, already split by dimension.
The catch: this export still reflects whatever row cap and date range you had selected in the UI. If you had the report filtered to top queries only, or if you had a 3-month date range selected instead of 16 months, the export mirrors that. It is a snapshot, not a bulk data dump, and it is a manual, one-time action every time you want fresh numbers.
Method 2: Search Analytics for Sheets (Add-on)
For anyone pulling this data more than occasionally, this free Google Sheets add-on is the better default. It is built directly on the Search Console API, so it can request more rows than the UI shows and can be scheduled to refresh automatically.
Installing it
- Open a blank Google Sheet.
- Go to Extensions > Add-ons > Get add-ons (on older interfaces this may show as Add-ons > Get add-ons).
- Search for "Search Analytics for Sheets" and install it. You will be asked to authorize it against your Google account, the same account that has access to your Search Console properties.
Configuring a pull
- Go to Extensions > Search Analytics for Sheets > Open Sidebar.
- Choose the verified site/property from the dropdown. This list includes any property type you have access to, including platform properties if you have registered one.
- Pick your date range (you can go back as far as the property has data, up to the 16-month limit).
- Choose your dimensions: query, page, date, country, device, and search appearance can all be selected together or separately. Selecting multiple dimensions gives you a more granular row for each combination, which is useful for something like "query + page + date" trend tracking.
- Set a row limit well above 1,000 if you want the full dataset; the add-on is not bound by the UI's cap.
- Click Request Data. The results populate a new tab in the same spreadsheet.
Scheduling it
The sidebar has a Schedule option that lets you set the pull to run automatically on a recurring basis (for example, weekly or monthly), appending new rows to a running sheet each time. This is the piece that actually solves the retention problem: if you schedule a monthly pull and let it run for two years, you now have a dataset longer than Search Console itself will ever show you, because you are stitching together twelve or so exports before any of them age out of the 16-month window.
Method 3: Google Search Console API via Apps Script (Advanced)
For teams that need something the add-on cannot do (writing data into a specific existing report format, merging it with non-Search-Console data before it lands in the sheet, or triggering the pull from another internal tool) the underlying option is calling the Search Console API directly from Google Apps Script, which lives inside every Google Sheet under Extensions > Apps Script.
At a high level, this involves enabling the Search Console API in a connected Google Cloud project, authenticating with OAuth so the script can act on your behalf, and writing a script that requests data from the searchanalytics.query endpoint with your chosen dimensions, filters, and date range, then writes the returned rows into sheet cells. This is meaningfully more setup than either method above and is really only worth it if you have custom logic the add-on can't express, since you are maintaining code instead of clicking through a sidebar. Most reporting use cases are well served by Method 2 without ever touching Apps Script.
Method 4: Looker Studio (When You Want a Dashboard, Not a Sheet)
If the actual goal is a live dashboard rather than a spreadsheet of rows, Looker Studio has a native Search Console connector that pulls Performance data directly, with the same dimensions available in the UI (query, page, country, device, date, search appearance). It is worth mentioning here because people often reach for a Sheets export when what they actually want is a shareable, auto-refreshing chart, in which case connecting Looker Studio straight to the property skips the spreadsheet step entirely. The tradeoff is that Looker Studio is built for visualization, not for the kind of freeform pivoting, formula work, or manual annotation you get in a spreadsheet.
Practical Tips and Edge Cases
- Combine multiple properties in one sheet. If you manage several properties for the same brand (a www domain, a subdomain, an app, or now a platform property), you can run separate Search Analytics for Sheets pulls into different tabs of the same spreadsheet, then reference them in a summary tab with formulas or a pivot table pulling from all of them.
- Watch for the "(other)" or omitted query bucket. When you sum query-level clicks and they do not match the page-level or site-level total, that difference is anonymized low-volume queries, not a bug in your export.
- Set your schedule before you need the history, not after. The 16-month window is a hard cutoff. If a stakeholder asks for a 3-year trend line next year, the only way you will have it is if you started archiving now.
- Keep dimensions consistent across pulls. If one month's export used query + page and the next used query + date, your archive sheet will not line up cleanly in a pivot table. Decide on a dimension set early and stick to it.
- Use a Pivot Table on the archive tab, not the raw export tabs, so new data pulls do not break your reporting view. Point the pivot at the full range of the archive sheet and it will pick up new rows automatically as the schedule adds them.
- Mind API and export sampling on very high-traffic sites. Extremely large properties can hit practical row limits even outside the 1,000-row UI cap; if a pull looks truncated, narrow the date range or dimension set and pull in smaller batches.
The Bigger Reporting Picture: Your Website Isn't the Only Data Source Anymore
Search Console just expanded what "search performance" even means. As of Google's July 2026 update, when you register a new property in Search Console, you can now choose Instagram, TikTok, X, or YouTube as the property type, alongside the standard URL-prefix or domain property. These platform properties track how that content performs specifically inside Google Search and Discover results, not inside the platforms' own native analytics. Google is stating outright what many SEOs already suspected: content on social and video platforms can rank in Search and Discover right alongside your web pages, and now it is measurable through the same tool.
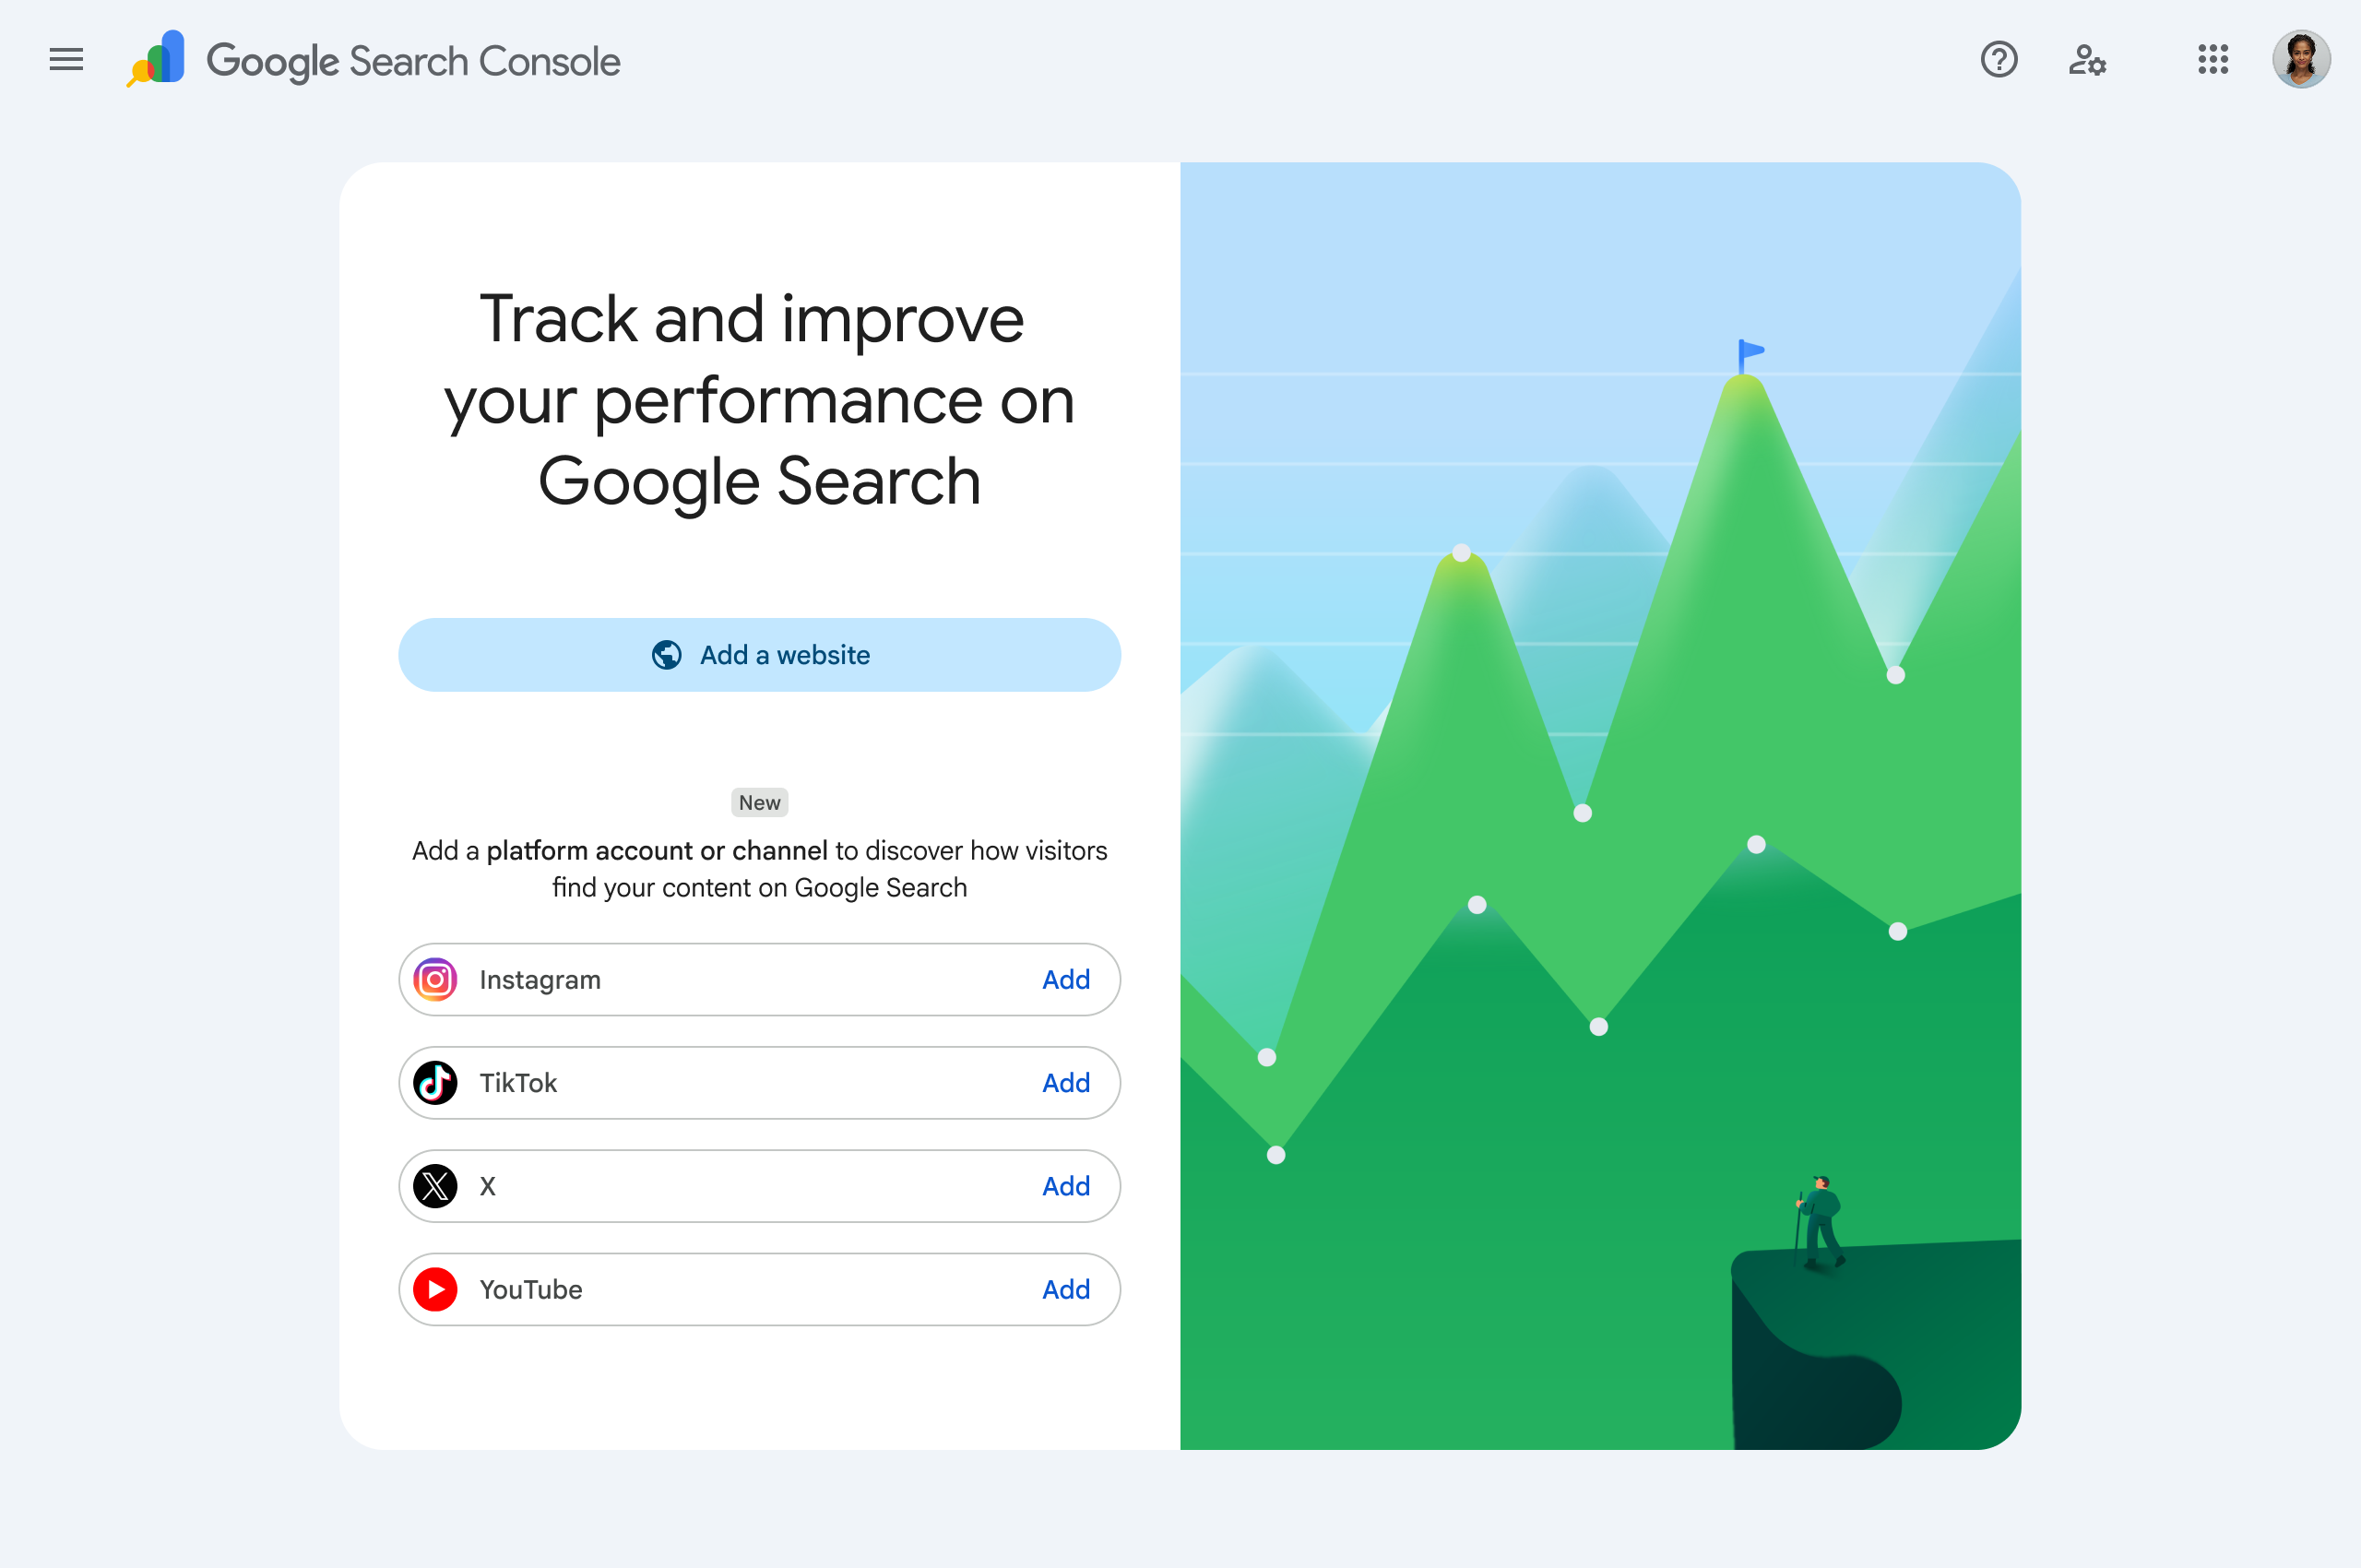
That changes what a "complete" reporting sheet looks like. A monthly client report that only covers website queries, pages, and clicks is now missing a data source that Google itself is explicitly surfacing. The practical move is the same one described above, applied more broadly: pull performance data from your website property and from your registered platform properties, and land them in the same spreadsheet so a stakeholder sees one unified view of search presence instead of a website report and a separate, disconnected social report.
A Short Next Step
Start with the free Search Analytics for Sheets add-on, pull the last full month of query and page data into a fresh archive sheet, and set the schedule to repeat monthly. That single habit, more than any specific export method, is what protects you from ever losing history to the 16-month window again. If you are also managing a platform property on X, Instagram, TikTok, or YouTube, pull that data into a second tab of the same sheet so your reporting reflects where your content is actually showing up in Search, not just where your website lives.
FAQ
Does the Google Sheets export from Search Console update automatically? No. The built-in Export button produces a one-time snapshot in Google Sheets format. It does not refresh on its own. For automatic, recurring pulls, use the Search Analytics for Sheets add-on and its scheduling feature, or a custom Apps Script pull.
Why don't my query-level clicks add up to my total clicks? Search Console anonymizes or omits very low-volume, potentially identifying queries from the query-level report. Their clicks and impressions still count toward your page and site totals, they just are not broken out as individual rows. This is expected behavior, not a data error.
Can I get Search Console data from more than 16 months ago? Not through the standard API or UI. Once data ages past 16 months, it is no longer retrievable, regardless of method. The only way to have longer history is to have exported and archived it before that window closed.
Is Search Analytics for Sheets an official Google product? It is a free, third-party Google Sheets add-on built on top of the official Search Console API, distributed through Google's add-on marketplace. It is widely used in the SEO industry and requires you to authorize it against your own Google account and Search Console access.
What's a platform property in Search Console, and do I need one? It is a new property type, alongside the standard URL-prefix and domain properties, that lets you track how your Instagram, TikTok, X, or YouTube content performs in Google Search and Discover specifically. You need one only if you want that visibility; it does not replace your website property, it adds a parallel data source for social and video content.
Should I use Looker Studio instead of Sheets? Use Looker Studio if the end goal is a live, shareable dashboard with charts that refresh automatically. Use Sheets if you need to manipulate the raw rows: custom pivots, formulas, manual annotations, or merging with data from other tools. Many teams end up using both, Sheets for the archive and analysis, Looker Studio for the client-facing view.